Since Moneyball was published in 2003, the idea that money is as much a part of the game as first basemen or the infield grass has become common knowledge. We all understand the basic notion that in Major League Baseball, money can define who plays on your team and therefore how your team plays. Basically, the story goes like this - wealthy, extravagant teams like the New York Yankees can buy their way to a championship. But the little guys, they have to gain an edge in other ways, developing farm talent and picking out the diamonds in the rough with advanced metrics. What Moneyball successfully conveyed is that even if money is limitless in baseball, it isn't everything. What the book didn't ask, however, is "Ok, so money isn't everything. But how much is it worth?"
Conventional Wisdom
It seems intuitive that teams with deep pockets can buy the best players and thus put together the best teams. But we see time and time again that small-market teams with smaller payrolls still manage to compete in baseball...the Oakland Athletics, the Tampa Bay Rays... But simultaneously, we see the wealthy Yankees dominate for two decades, we see the Red Sox come to power in the early '00's on a rising payroll, and we see the 2013/14 Dodgers spend (and win) like there's no tomorrow. Conventional wisdom seems to point in both directions. Who's right?
Various sources have tried to tackle this question in variously incomplete ways. Wikipedia notes that "...the New York Yankees have consistently had the highest total payroll in MLB, and they have appeared in 40 of the 109 World Series for 27 wins as of 2013..."1 That's great, but the Yankees are only an anecdote. Somebody at Columbia Business School did a deeper investigation of the idea and concluded that 20% of success in baseball can be attributed to payroll2. Okay. 20% is money; the other 80% is...skill? But how can we say that? And how has that trend evolved over time?
A brief history of Baseball salaries
Baseball stands apart from other North American sports in that it doesn't have a salary cap - teams can spend whatever they want on players! In the NFL or NBA, payroll can't logically have a powerful effect on a team's wins; each team has the same chips to play with. But baseball has never operated this way. I think it's worth a look back (real quick, I promise!) to understand how we ended up here.
When baseball began, teams owned players. And I mean owned. Players either played for the team that controlled their rights, or they didn't play baseball at all. Free agency didn't exist. Trades were the only time a player switched uniforms. Salaries were relatively consistent across teams because intra-team collusion held player salaries down.
Then came the 1970's. Players banded together and negotiated Free Agency. Free Agency meant that a player could enter the open market and auction his talents to the highest bidder, thus opening the floodgates for spending in baseball. Teams with the money could simply outbid their opponents for a free agent they wanted while poorer teams had to scrape the barrel. Suddenly, artificially low player salaries skyrocketed as the colluded market rebalanced.3
We can actually witness this rebalancing happening, as salary data since 1977 is publicly available. I cobbled team payroll data together from a few sources and while it isn't perfect, it's the best we have.4 You can download my raw data here if you like.
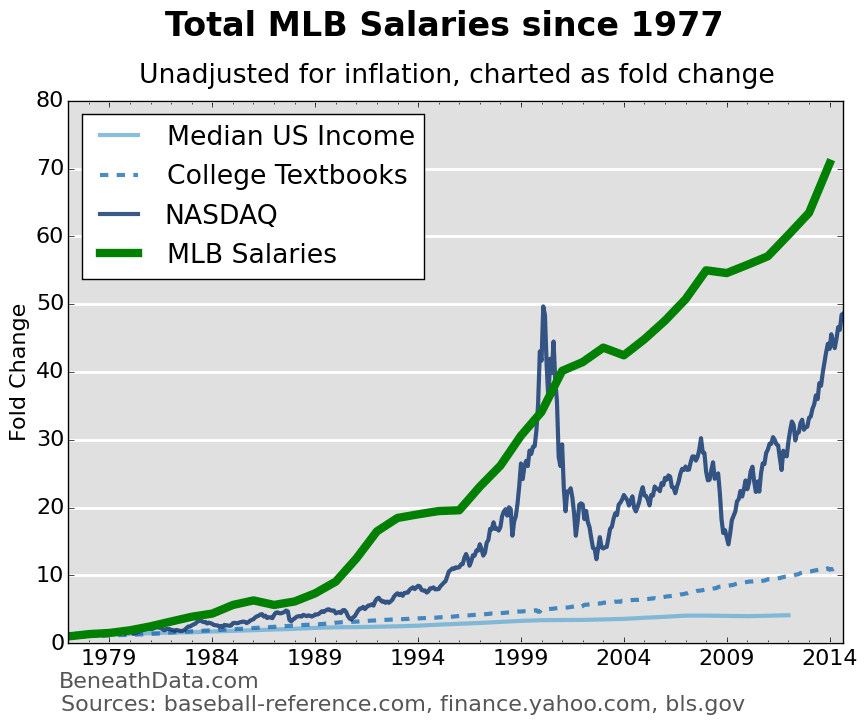
Since 1977, MLB salaries have increased a whopping 71 times over (unadjusted for inflation). If somehow you were able to invest $10k in an index fund of baseball salaries 40 years ago, it would now be worth nearly three-quarters of a million dollars. By contrast, the median US income has only increased 4x and the entire NASDAQ (which barely existed in 1977) "only" 45x.
Team Wins vs Team Payroll
Because of this massive growth in player salaries, we can't simply compare team payroll dollar values across the years. So, I normalized payrolls using a metric called Median Absolute Deviations (MAD). You can think of MAD as just standard deviations from the mean, but less sensitive to outliers (ahem Yankees ahem). If you don't know what a standard deviation is, just think of MADs as normalized payroll.
Now, we can compare payrolls of teams from 1976 to 2013 to each other. Let’s just take the dummy approach – plot the wins vs normalized salary of every single team since 1977, broken down into roughly 10-year periods.
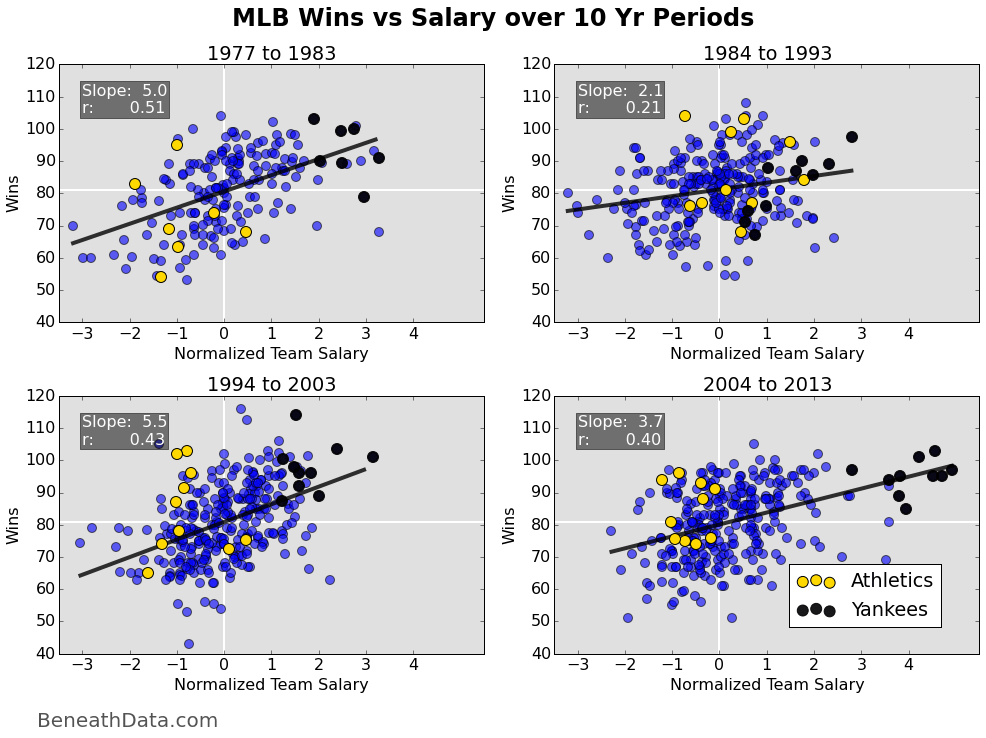
There’s definitely a positive relationship there, implying that money DOES affect wins. Looking at the best fit line, we can get an idea of the magnitude of that relationship which I'll just call "Normalized Salary Power" or "Salary Power". Salary Power is between 2 and 5.5 since 1977, but the data is noisy. We can say "sure, money has a nonzero effect on baseball," but there’s data points all over the place that buck the trend. Is this noise because of the inherent randomness in a baseball season, or is it because money has a really weak correlation with winning? Both? At the very least, it’s amusing to look at the A’s vs the Yankees post-1993.5
Effect of Money Long-Term
Let’s adjust our hypotheses – it’s not JUST money that wins baseball games. More specifically, it’s money applied over time. This makes intuitive sense - even with a huge payroll it takes years to build the right team, develop prospects, and see your investment pay off. Below you’ll see the same graph as before, just with each team averaged into a single data point.
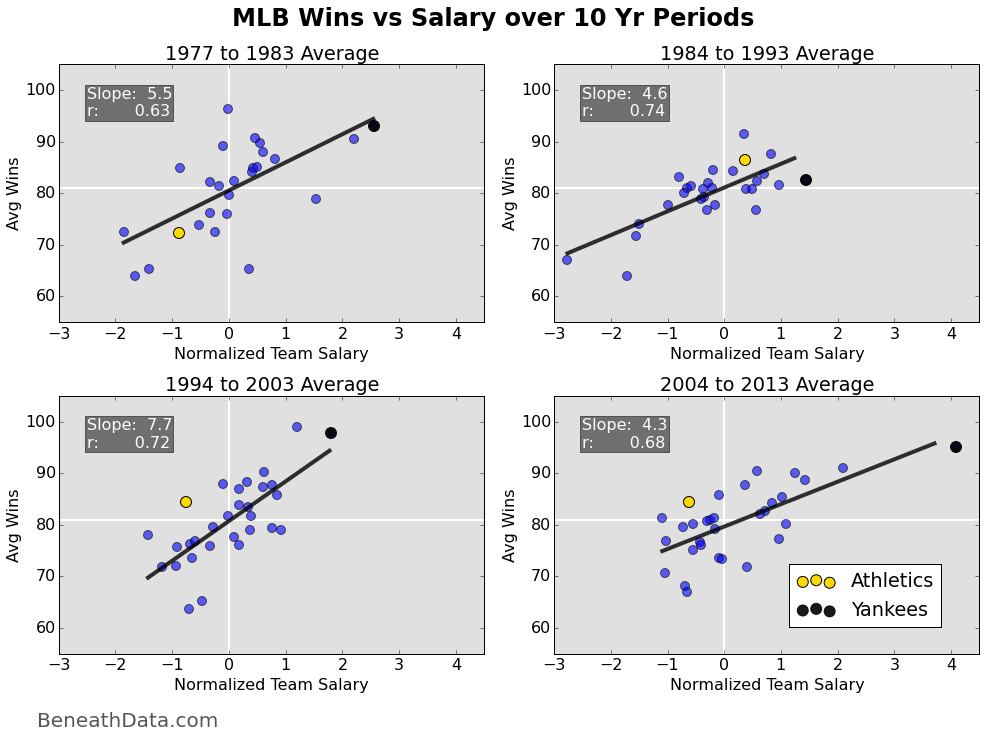
Salary Power has increased slightly and the r values have increased considerably, to well above 0.5 and into the "pretty decent" correlation zone. It would be fair to conclude that payroll, when kept high over time, has a significant effect on the performance of a team. How significant? The slope of the correlation (Salary Power) hovers in the neighborhood of 5 wins per MAD (standard deviation). This means you could expect a team like the Yankees who consistently outspends the median by 2 MAD to win 10 more games than league average, or 91 games a year. 91 games pretty much assures you a spot in the playoffs nowadays - that's how powerful the effect is.
Right now, you should be feeling an uneasy confidence that wins in baseball can be bought.
The Competitive Balance Problem and MLB Revenue Sharing
If you were paying close attention to the previous graph, you noticed that Salary Power has changed over the decades, peaking in the ’94-’03 era at 7+ wins/MAD. Honestly, if you’d put a gun to my head and made me guess what 10-year period would show the most powerful monetary effects, I would have guessed essentially these 10 years. Here’s why. MLB payroll has plenty to do with the owners' pockets, but even MORE to do with a team's revenue. If you’re a big market team then sure, you’ll get better attendance and more purchased merchandise. But that's not where your revenue comes from. Beginning in 1990, baseball saw the first truly, insanely lucrative TV deals being to pop up in places like New York and LA. With their newfound cash prospects, some teams were suddenly able to outspend their opponents by ridiculous margins.
To quote a more reputable source than I:
As the importance of media contracts grew, so did the problems associated with them…These local contracts did not pay all teams, only the home team. The problem from MLB’s point of view was not the income, but the variance in that income. That variance has increased over time, and is the primary source of the gap in payrolls, which is linked to the gap in quality, which is cited as the “competitive balance problem.” In 1962 the MLB average for local media income was $640,000 ranging from a low of $300,000 (Washington) to a high of $1.2 million (New York Yankees). In 2001, the average team garnered $19 million from local radio and television contracts, but the gap between the bottom and top had widened to an incredible $51.5 million. The Montreal Expos received $536,000 for their local broadcast rights while the New York Yankees received more than $52 million for theirs.
Talk as much as you want to about George Steinbrenner, but the YES Network might be a bigger reason why this generation's Yankees are who they are.
We can better investigate the changing influence of money in baseball by looking at Salary Power from year to year.
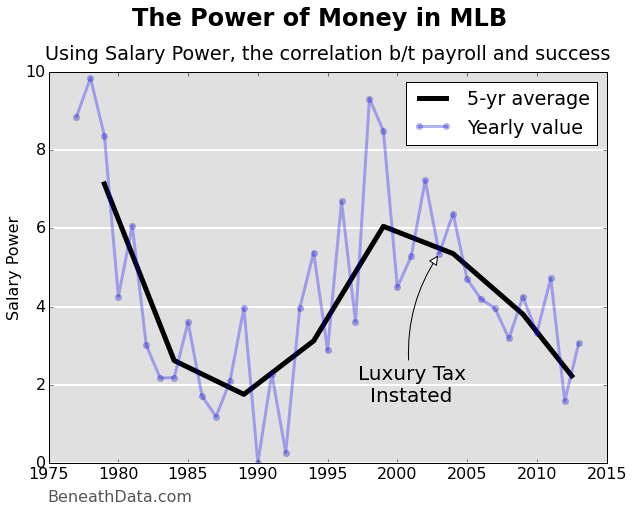
Charted above you’ll see Salary Power plotted annually and as a 5-year running average. The data here is pretty damning. Since we have reliable salary data, Salary Power has been well above zero every year. From 1995 to 2011, it never went below 3. As we saw before, the late 90's and early 00's had incredibly high Salary Power numbers, at one point reaching 9 (!!) wins/MAD. The Salary Power running average in particular (in black) paints a consistent story, which I will narrate myself.
<ahem>
When Baseball transitioned to the free agent model in 1976, some teams jumped on the opportunity and spent heavily on free agents. These teams performed well - much better than their adversaries. But over the next 10 years, as teams learned how to navigate free agency and spend their money wisely, the competitive balance began to equalize. No one team or group of teams had the resources to outspend opponents and unbalance the equation. Not even Steinbrenner’s Yankees.
Then came 1990. TV contracts began to develop into insanely lucrative deals. But unlike before, there were haves and have-nots, mostly dependent on the size of the TV market and contract. The competitive balance began to unbalance again, peaking around the millennium. Not coincidentally, around this time the Commissioner’s office was getting inundated with complaints. In fact, forget the Commissioner, the US SENATE convened multiple sessions on the matter!. To address the growing problem, Bud Selig created the Blue Ribbon Panel which, in 2000, basically concluded that Major League Baseball was badly imbalanced.
In part based on the Blue Ribbon Panel's suggestions, MLB instituted some changes in 2002's Collective Bargaining Agreement, broadly called "revenue sharing". The most controversial part of the agreement was a new Luxury Tax which targeted the highest spending teams and provided a disincentive for overspending. The penalty was nontrivial – 17.5% of overages paid in tax, then 30%, 40%, and 50% for each year over the line.6 To magnify the effect, these taxes were paid out to the poorest teams, effectively redistributing TV revenue if you think about it. (Edit: luxury tax is not redistributed to poorest teams, it is paid into player benefits and development). Revenue sharing also required all teams to put 39% of their net local income into a pot where it would be redistributed evenly among all teams.7 If you re-examine our above graph, you’ll notice a precipitous drop in value beginning roughly around 2003, coinciding with the new CBA revenue sharing rules. Maybe, just maybe, revenue sharing has been having an effect...
Today, Salary Power in baseball is back to around its 1990 levels, according to my graph. Bud Selig can count that as a big victory for revenue sharing and competitive balance. And you, as a discerning baseball fan, can sleep easy knowing that balance has been returned to the league.
...Right?
I'm not so sure.
Competitive Balance and the Playoffs
To see if competitive balance has indeed improved since 2003, let's change our metrics a bit. First off, let's break teams into quartiles by annual payroll. Second, let's start looking at the postseason.
We can debate money's effect on regular season success all we want, but teams play to win the World Series, not to win 91 games. Just ask Oakland A's fans.8
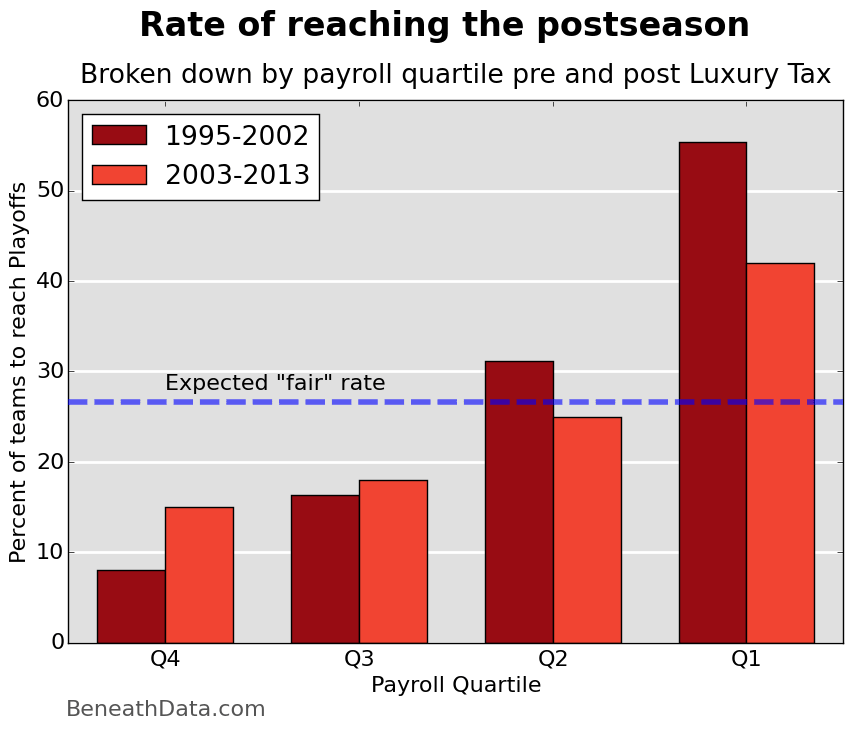
Selig's Blue Ribbon Panel found in 1999 that poor teams were not flat out making the playoffs. They were correct. Examining the figure above, we see that from 1995-2003, a meager 12.0% teams in the bottom half of league payroll (Q4 + Q3) were making the playoffs. Conversely, teams in Q1 were making the playoffs more than half the time.
Let's think about the magnitude of that statement for a minute. That is atrocious. In a completely balanced league, we'd expect see a 26.7% playoff rate (8 playoff slots for 30 teams) across each quartile.9 We're nowhere close.
When we look at the same numbers from 2004-2013 above, we do see an improved picture. We see an uptick in Q4 and Q3 teams making the playoffs plus a corresponding decrease in playoff rate for Q1 and Q2. But Q1 remains well above random chance.
So, YES, the Luxury Tax and other revenue sharing solutions seem to have made a difference, but no, it hasn't leveled the playing field. Not even close.
Winning it All
We're nearing the end here, so let's zoom out a bit. Below you'll find the chance of reaching or advancing past each level of the playoffs, broken down by salary quartile. It paints the same picture as before, just uglier. As you advance further into the playoffs, the chances only get worse for the poor teams in Q3 and Q4.10
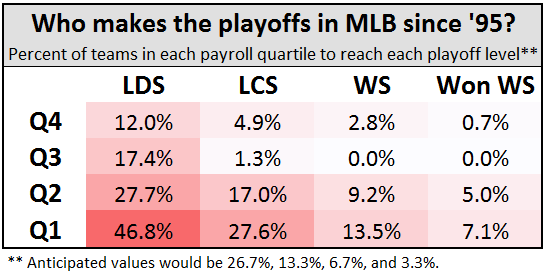
Looking to the World Series only paints a worse picture.
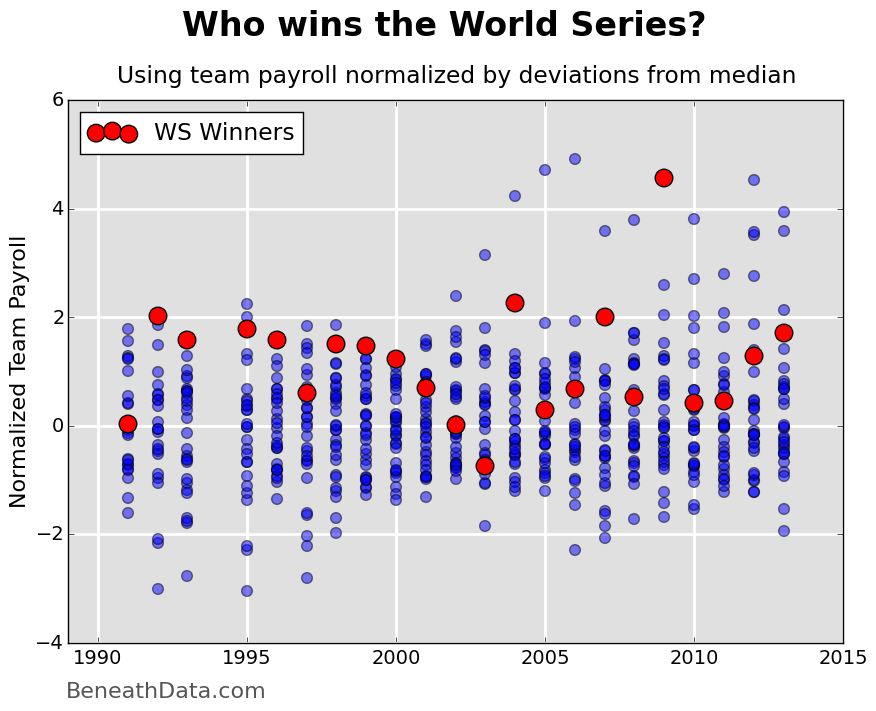
Essentially, teams in the bottom half of payroll don't win the World Series. Since '90, exactly ONE team has won the World Series with a below-average payroll.
ONE.
That team? The 2003 Florida Marlins with a payroll of $49M, good for 24th in baseball. And, if you’ll remember, the ‘03 Marlins were unusual for a few reasons - they had massive production from some very young (and thus very cheap) players - rookies Miguel Cabrera and Dontrelle Willis plus 2nd year Josh Beckett. On top of that, their WS run was anything but easy. They needed a brilliant tag at home by Ivan Rodriguez in the NLDS to advance over the Giants and then, in the NLCS, you may remember this:
So, ONE team has won the World Series in the past 23 tries with a below-average team payroll.
What does that say about the effect of money on baseball success that I haven't already said?
For a reference, if all teams were evenly talented, the odds of a Q3 or Q4 payroll team winning only 1 of 23 World Series is about 1 in 365,000, or roughly three times less likely than being struck by lightning.
Wrapup
So, what have we learned? If you skimmed this article (understandable) hoping for a tl;dr, we've seen that:
- Salary Power in baseball peaked around 2000, and has fallen since to a 20-year low in 2013.
- The Luxury Tax and other revenue sharing methods have helped improve the competitive balance, but money still buys wins (about 3 wins per deviation).
- MLB playoffs remain a money-gated event, with wealthy teams vastly outperforming poor teams.
Look, baseball doesn't need to be perfectly income-agnostic to be a fun sport to watch. Wealthy ownership comes and goes, teams develop young (cheap) prospects, franchises rise and fall. But let's just be clear about it - if your favorite team is spending in the bottom half of baseball, you can basically kiss your World Series hopes goodbye.
Footnotes
- wikipedia source ↩
- source ↩
- if this stuff floats your boat, go check out a great history of the economics of baseball here ↩
- I collected information on team history from the great baseball-reference.com and cobbled together team salaries from a few wonky resources. Salary data hasn't always been available. Nearly nothing is out there from before 1977 though, since 1985, team salaries have been publicly released by the MLBPA. So the data set we'll have to work with covers 1977 to 2013, with high confidence in the data post '85. ↩
- Notice the A’s in the 80’s and early 90’s – their heyday. They won the World Series, they had incredible stars like Dennis Eckersley and Ricky Henderson. They were on top. It’s also the only time in their history spent in the top half of the league. Now look at the years since 1994 – their payroll has been consistently in the bottom half and yet they’ve been winning above the best fit line. This is evidence that at least part of Moneyball’s thesis is true – smart teams like the A’s can outperform their salaries. On the other hand, look at the Yankees. Nearly always waaaay out to the right. Nearly always winning. They set the trend. They are the reason for the Luxury Tax. ↩
- However, over 90% of Luxury Tax since 2003 has been paid out by the Yankees. If this helps paint a picture, the entry for Luxury Tax on Wikipedia has only one photo – a closeup of George Steinbrenner’s grumpy, wrinkly face. ↩
- Great explanation of revenue sharing here ↩
- Or Atlanta Braves fans...sigh. ↩
- This would be for completely random chance played out in the long run. Obviously there would be fluctuations from year to year ↩
- Doing some additional math, Q3 and Q4 reach the playoffs at a ~1:3 ratio compared to Q1 (15% to 47%). But reach the World Series? Now we're down to 1:8 ratio (1.4% to 12.1%). ↩
Comments
comments powered by Disqus